LOOKUPROW Function
LOOKUPROW looks up a value in a row of another result set using a specific row index, and returns the value in a specified column in that row.
LOOKUPROW(index_of_row_to_return, index_of_column_to_return, optional_parameter, optional_parameter,... , BQL_query)
Optional parameters can be expressions, constants, columns from the main query, or a combination. Using parameters, the lookup query can depend on expressions derived from the main query itself. This technique allows multi-pass calculations.
Reference each parameter expression in the lookup query using %index syntax. The first parameter is numbered %0, the second %1, etc.
Important: Parameters require the lookup query to be issued for each row in the parent query and can affect performance. Use the display filter DISPLAY WHERE syntax to run these queries against the returned dataset in cache for improved performance. See Display Operations.
Tip: LOOKUPROW can return a value from a data set that doesn't join with the data in the report. For example, the grayed-out attributes or measures in Designer or Visualizer that don't join with what is already on the report, can be accessed with LOOKUPROW.
Example LOOKUPROW Using a Parameter
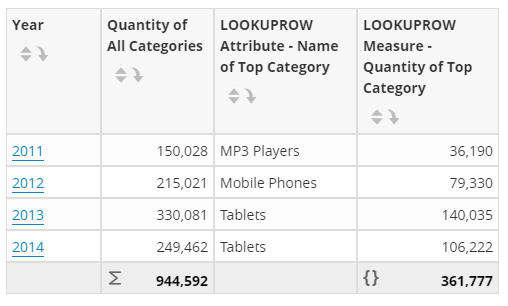
For example, to return the overall quantity per year, and the top category and its quantity for each year, the first measure is Quantity and the first attribute is Time.Year. The top category per year is a result of the following LOOKUPROW attribute expression that uses a query parameter, Time.Year :
LOOKUPROW(0,0,[Time.Year], SELECT [Products.Categories], [Order_Date: Sum: Quantity] FROM [ALL] WHERE [Time.Year]=%0 ORDER BY [Order_Date: Sum: Quantity] DESC)
In the preceding LOOKUPROW example, the first 0 indicates that it will be returning an item from the first row in the lookup query. The 2nd 0 refers to which column from the lookup query to return, in this case it's the first column so the expression will return [Products.Categories]. [Time.Year] is a parameter being passed from the main query. Note that in the lookup query the data has been ordered by the Sum of Quantity descending, so the Category with the largest quantity will be the first row. In summary, this expression will return the Product Category that had the largest Quantity in a for each year in the main query.
The top quantity of the top category per year uses the following LOOKUPROW measure expression. The difference is that the measure comes first in the lookup query.
LOOKUPROW(0,0,[Time.Year], SELECT [Order_Date: Sum: Quantity], [Products.Categories] FROM [ALL] WHERE [Time.Year]=%0 ORDER BY [Order_Date: Sum: Quantity] DESC)
The query for the report, from Visualizer Advanced Tools - Queries:
SELECT TOP 100 USING OUTER JOIN LOOKUPROW(0,0,[Time.Year], SELECT [Order_Date: Sum: Quantity], [Products.Categories] FROM [ALL] WHERE [Time.Year]=%0 ORDER BY [Order_Date: Sum: Quantity] DESC) 'COL0' , LOOKUPROW(0,0,[Time.Year], SELECT [Products.Categories], [Order_Date: Sum: Quantity] FROM [ALL] WHERE [Time.Year]=%0 ORDER BY [Order_Date: Sum: Quantity] DESC) 'COL1' , [Order_Date: Sum: Quantity] 'COL2' , [Time.Year] 'COL3' FROM [ALL]
The Visualizer report: