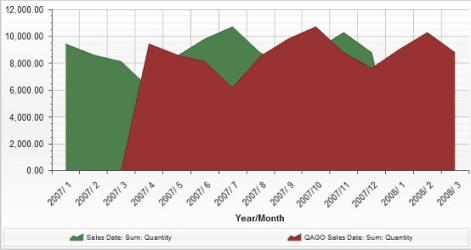
area chart
A chart that displays series values as sets of overlapping filled regions. It is similar to a line chart, with the area between the axis and line filled in with color. An area chart is commonly used to compare two or more measures. It requires at least one category and one measure.
