Visualizer gives you the option of using Turbo charts that render more quickly than standard charts. This is particularly useful for charts on dashboards that are viewed on mobile devices. By default on Birst Mobile apps, all charts render in Turbo mode if available.
By default all new Visualizer charts use Turbo. You have the option of updating old charts to the new style.
Important: Review the information in this topic before updating charts. Once saved, an updated chart cannot be reverted to the old style. See the 5.23 Release Notes for Upgrade Notes and Known Issues.
Currently supported Turbo-style charts include:
- Area
- Area Spline
- Bar
- Bubble
- Column
- Donut and Semi-donut
- Funnel
- Heat map
- Line
- Pie
- Points
- Scatter
- Spline
- Tree map
- Waterfall
Tip: Visualizer continues to support additional Turbo chart types over time. The Geomap chart style is only available in the old style.
Differences Between Old-style and Turbo Charts
The following are differences that will affect the behavior or look-and-feel of reports that are changed to Turbo. Stylistically, Turbo does not exactly match the old style.
Improvement to sorting report attributes by attributes that are not displayed
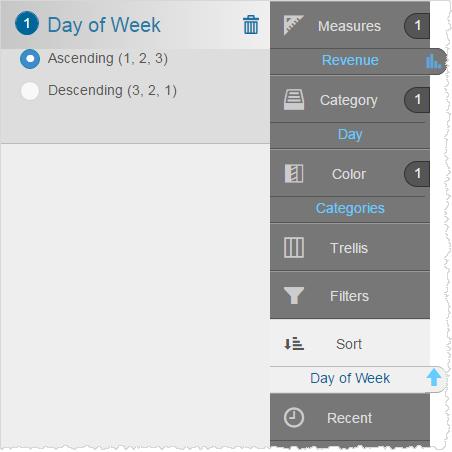
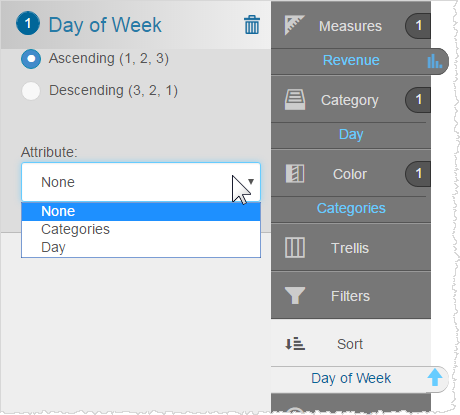
Old-style charting does not allow the Visualizer user to designate which attribute should be sorted by a hidden (sometimes called "unvisualized") Sort attribute. Turbo adds this functionality and requires users to set what displayed attribute should be sorted by the attribute that is not displayed.
For example, in the old-style charting a sorting attribute that is not shown on the report does not indicate what is actually sorted.
In a Turbo chart, users can select which attribute is sorted.
Change in the order of how colors are allocated
Old-style charts had a problem where colors were not allocated in the order of color attribute values. Turbo chart now correctly allocated the colors in proper order. Due to this change, the order of stacked Color attribute values will change. An example of a line chart with different color ordering is shown in the screenshots below.
The thickness of the lines and points on line/spline/area/areaspline charts are different
Ostyle: 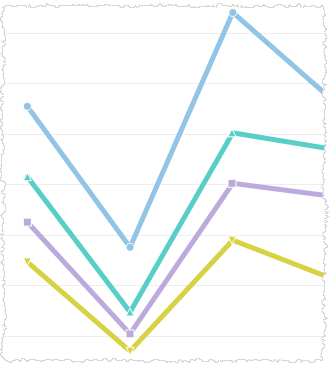
Turbo style: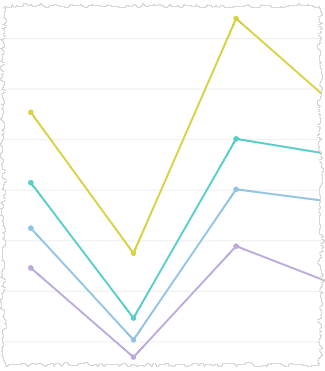
Point shapes and border/shadow in line/spline/area/areaspline chart are different
Old style: 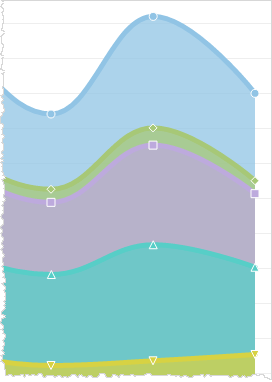
Turbo style: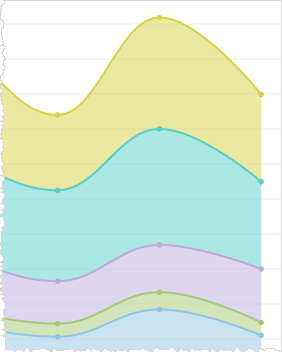
Rectangles in Turbo chart images do not have white dividers/borders
Old style: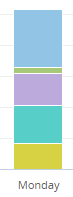 Turbo style:
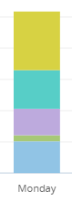
To update old-style charts to Turbo
- Open the old chart in Visualizer.
- In the Chart Settings menu toggle the Use Turbo Charts option.
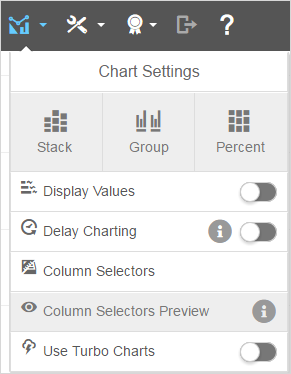
This option applies only to the open chart, not to any other charts. - Try out the new chart. If you change your mind, toggle it back.
- Save the chart.
Important: If you change a chart to Turbo and save it, it can never be changed back.