Visualizer supports custom geomaps. For cases where the built-in geomaps do not provide the geography you need, use a custom map. Custom geomaps are supported using the Keyhole Markup Language (KML) format.
Prerequisites
Before creating a geomap with a custom map file:
- Create or obtain a map in KML format that corresponds to the data in the relevant attribute. For example, since there is no standard definition for United States regions, the built-in maps do not support a United States Region attribute, and therefore a custom KML file is needed.
- The KML file size must be 20MB or less.
- Visualizer requires that the KML files have the following structure:
<kml>
<Document>
<Placemark>
</Placemark>
<Placemark>
</Placemark>
...
</Document>
</kml>
OR:
<kml>
<Document>
<Folder>
<Placemark>
</Placemark>
<Placemark>
</Placemark>
...
</Document>
</Folder>
<Folder>
</Folder>
...
<Document>
</kml>
To add a custom map
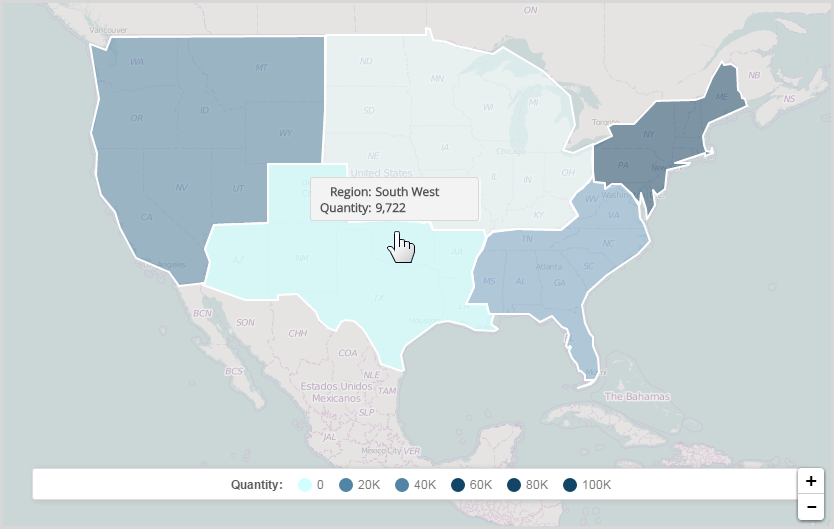
- Create a report of type geomap and add a measure and attribute. For example, Quantity by Region.
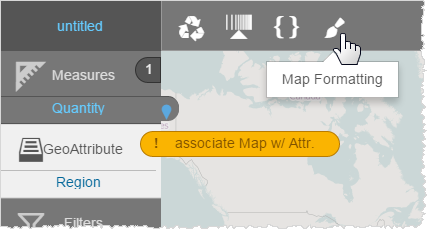
Tip: If there is no map associated with the attribute, Visualizer displays a warning message. This message will go away once you upload the KML file and associate the custom map with the attribute. - Click Map Formatting.
- Click Custom Maps.
- Click Upload Custom Map.
- Navigate to the KML file and click Open. Visualizer uploads the map file and adds it to the Custom Maps list.
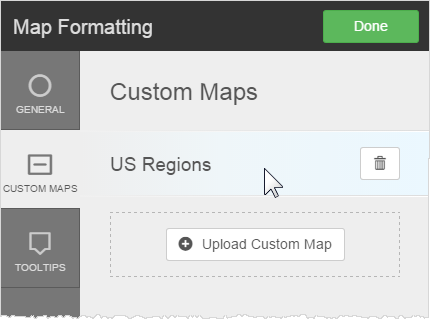
- Click Done.
To apply a custom map to a geomap
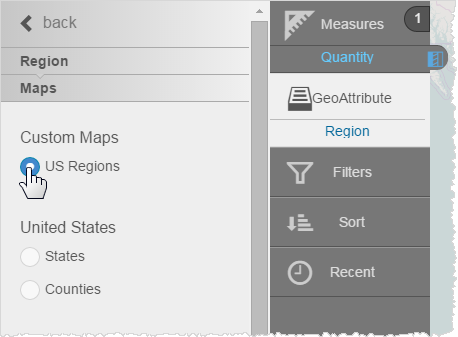
- Select the attribute in Chart Builder and see its properties.
- Click Maps.
- Assign the custom map to the attribute.
The geomap updates, for example with Quantity measure and the Region attribute using the new US Regions geomap.