Can I change the columns that are shown in a chart on Android?
If a report has been set up for it, you can pick different data to show. For example, a report may show Quantity by Category, and you can change it to show Quantity by Country. This feature is called a column selector.
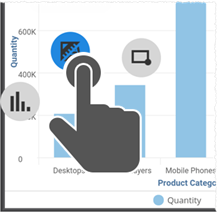
Press on a chart to show its chart menu bubbles.
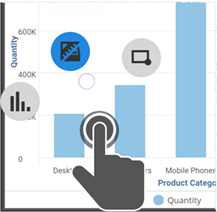
Keep pressing and slide to select the Column Selector menu.
Tap the expand/collapse icons to show the available options. Tap to select another column.
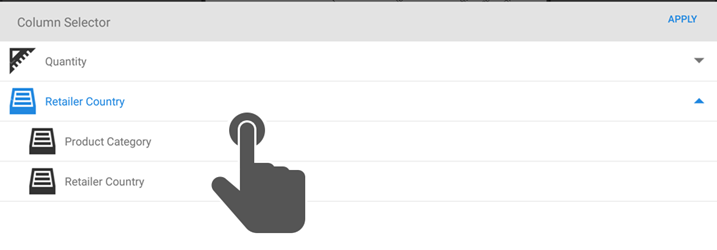
The chart re-draws with the new data.