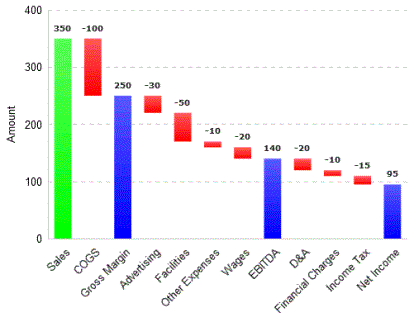
waterfall chart
A chart that displays the cumulative effect of sequential additions and subtractions. It requires two categories (one for the items to be measured and one that groups the items and is sorted) and one series for change values. Green bars indicate positive values, red bars indicate negative values, and blue bars show the subtotal of the values in the second category.
