stacked area chart
A chart that displays all series stacked with a single area for each attribute or measure. An area chart requires at least one measure and one attribute. Adding an additional measure or attribute results in a stacked area chart.
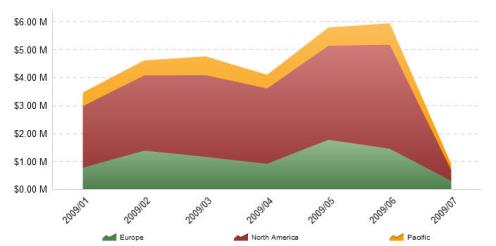
Note that the data points in a stacked area chart show the measure for each area. The sum of all the areas is indicated by the Y-axis.
Designer Area Chart, stacked: