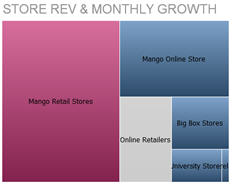
heat map
A chart that displays series values in a matrix of two categories. It is a graphical representation of data where the values taken by a measure in a two-dimensional map are represented as gradations of a color. This chart type requires at least two categories and one series.