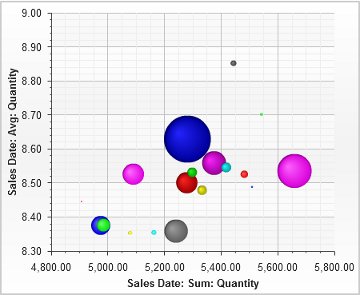
bubble chart
A chart that displays series values as a set of bubbles. It is similar to a scatter plot, with the addition that a third series supplies the size of the bubbles. It requires at least one category and three series (x and y coordinates and size).