Positional Calculations
Use positional calculations in report expressions to efficiently calculate new values based on related values. These calculations are helpful for common reporting tasks such as comparisons and shares of a whole.
Positional calculations occur in the middle tier (in memory or in file cache). The original query must return data from the database that satisfies the needs of the positional calculation.
Important: The “Push Down Expressions to Database” feature supports all report expressions except those that include positional calculations and dimensional expressions. To use these, you must disable “Push Down Expressions to Database”.
Single Comparison (Absolute Position)
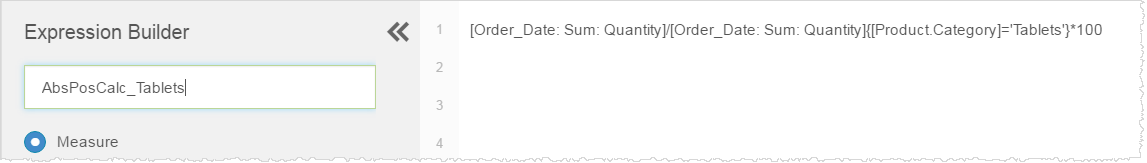
An absolute position in a positional calculation compares how one or more values relate to another particular value. For example, to understand how sales in different product categories relate to sales in the Tablets category:
[Order_Date: Sum: Quantity]/[Order_Date: Sum: Quantity]{[Product.Category]='Tablets'}*100
The expression in Visualizer Expression Builder:
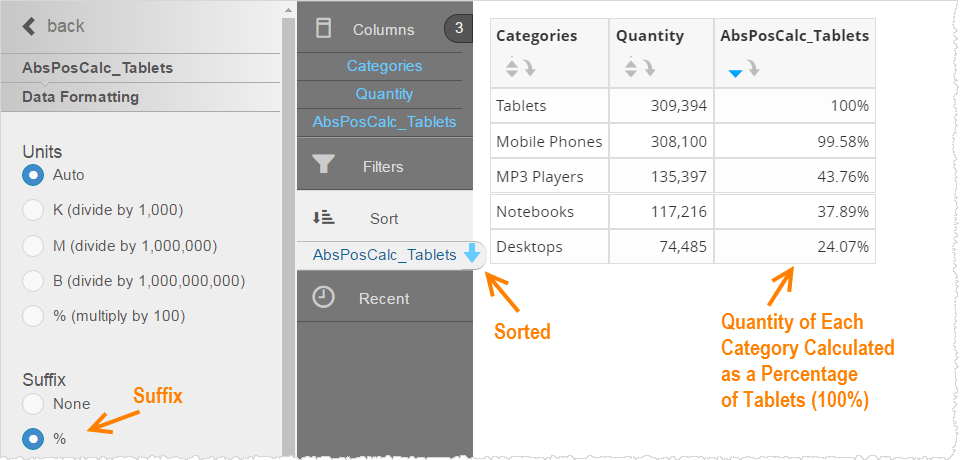
The report in Visualizer:
Sibling Comparison (Relative Position)
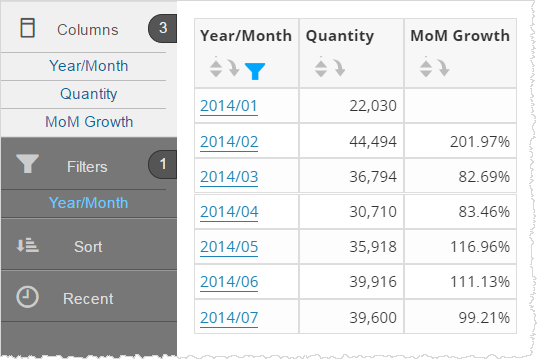
A sibling or relative position in a positional calculation compares related values to each other, not just to one other. For example, month over month growth:
[Order_Date: Sum: Quantity]/[Order_Date: Sum: Quantity]{[Time.Month Seq Number]-=1}*100
Note the syntax is -= (not a typo).
Example Visualizer report:
Share Calculation (Position at Higher/Lower Levels)
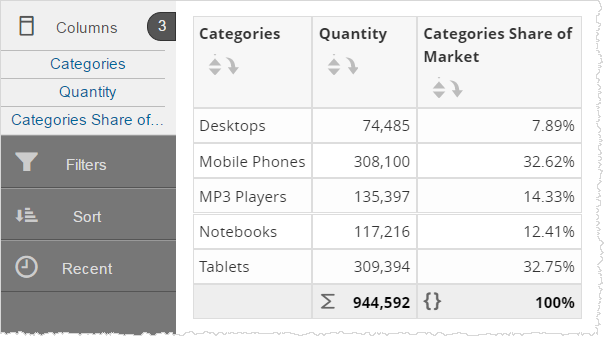
Use a share calculation to see how much each product makes up of the entire product category. You reference both levels in an expression.
For example, assuming that the report breaks sales out by products, the following expression calculates the share of a specific product of the overall product category, using the special Total column:
[Order_Date: Sum: Quantity]/[Order_Date: Sum: Quantity]{[Products.Total]}*100
Example Visualizer report:
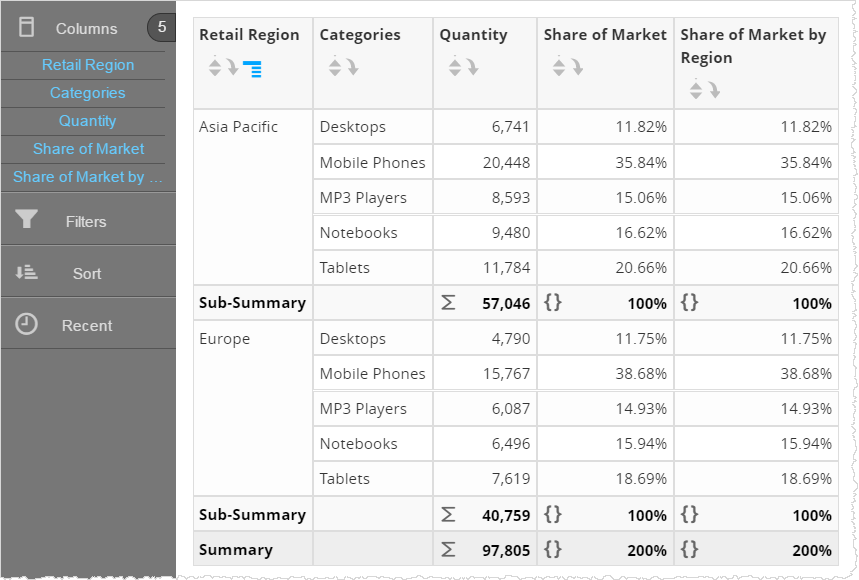
Positional Calculation Across Two Dimensions
For example, sales for each category across regions, using two Total columns:
[Order_Date: Sum: Quantity]/[Order_Date: Sum: Quantity]{[Products.Total]}{[Retail_Stores.Total]}*100
Example Visualizer report (result set limited):
Grand Totals with the Special Total Column
Sometimes it is useful to get the grand total for a given measure along a given dimension. To accomplish this, Birst supplies the special column called Total.
For example, to calculate the share of a product category of the grand total for all products:
[Order_Date: Sum: Quantity]/[Order_Date: Sum: Quantity]{[Product.Total]}
Tip: This column does not appear in the Visualizer subject area, however it is used in Visualizer column properties Grand Total function.