Edit Connection Objects
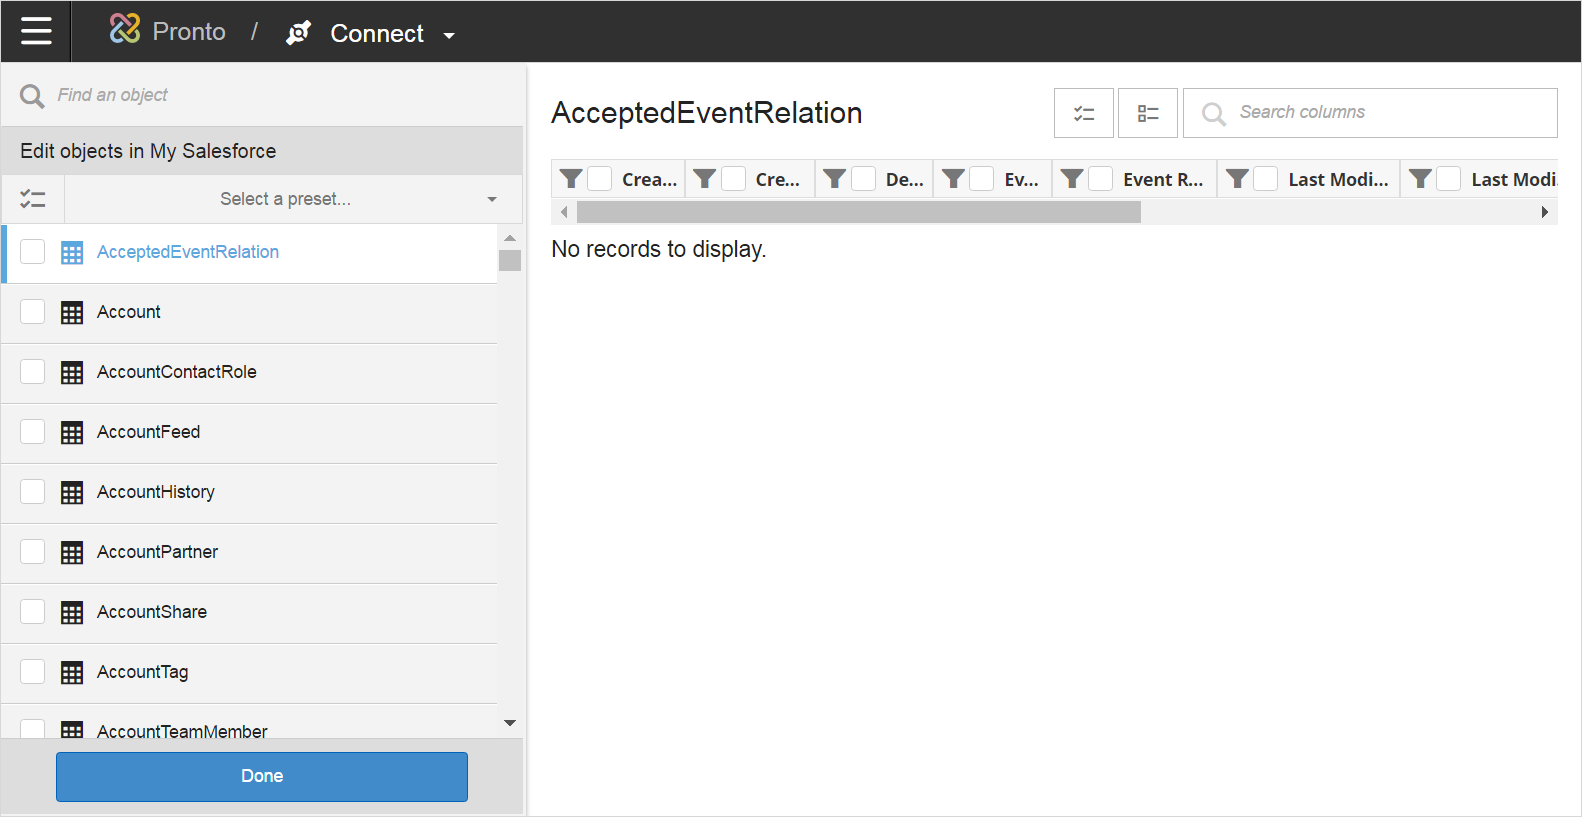
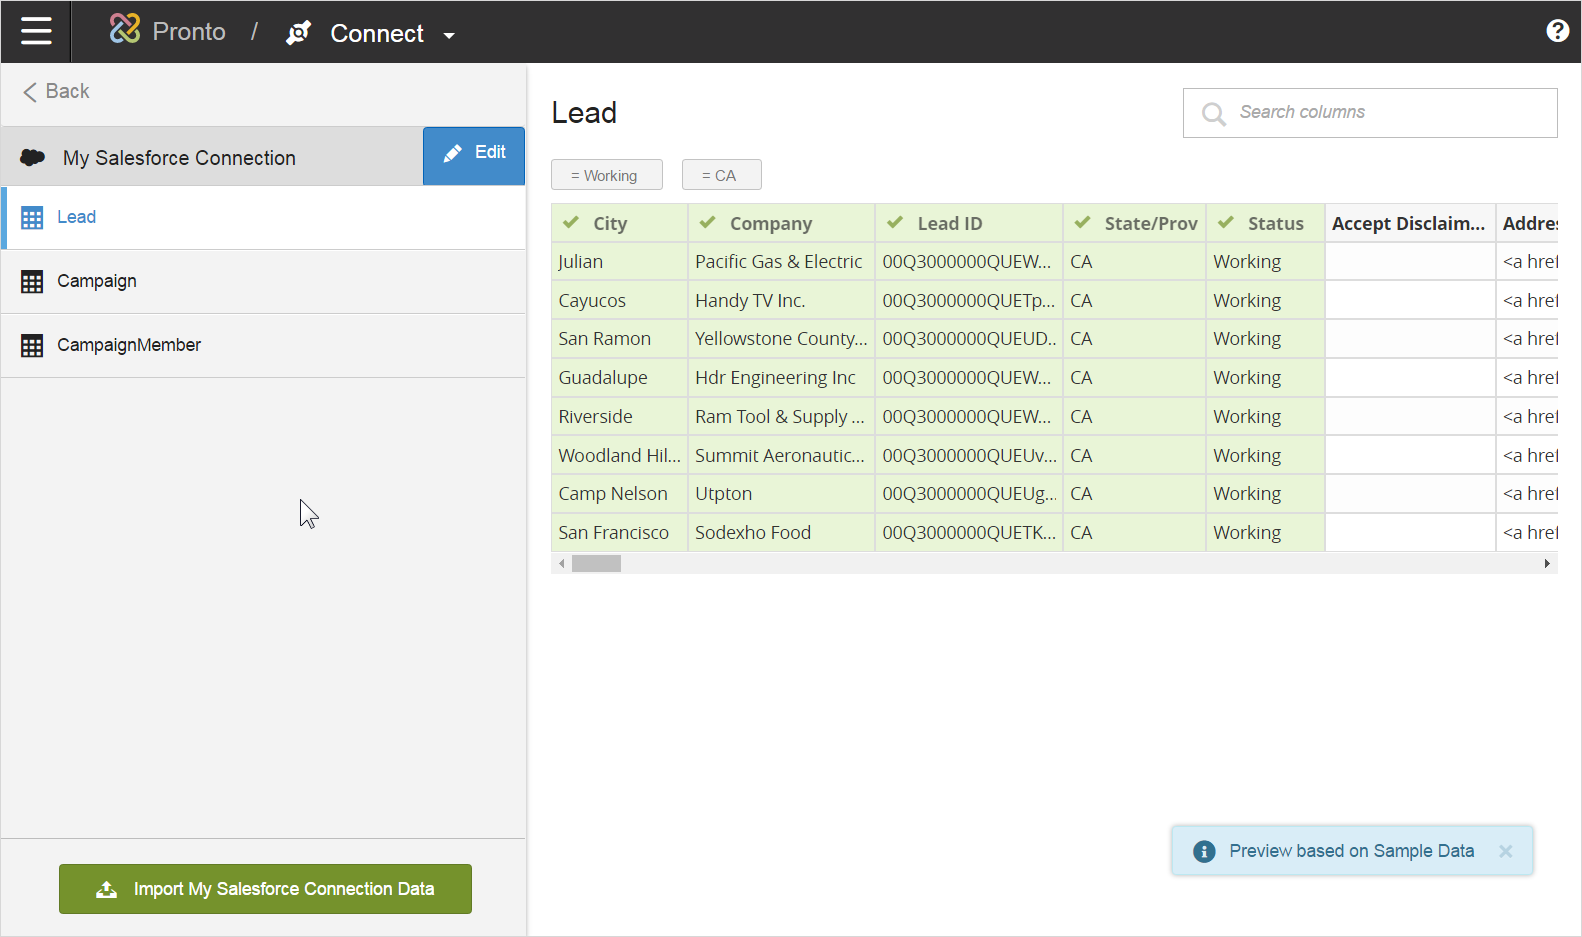
After saving your connection, Modeler accesses the connected application and returns the list of available tables. The list of tables display on the left panel, while a preview of the first table with its first 100 rows displays in the main panel. If the first table does not contain any rows, the preview will be empty and state No records to display.
Next, select the tables that you want from your connection. The Recommendations menu displays popular tables or sets of related tables.
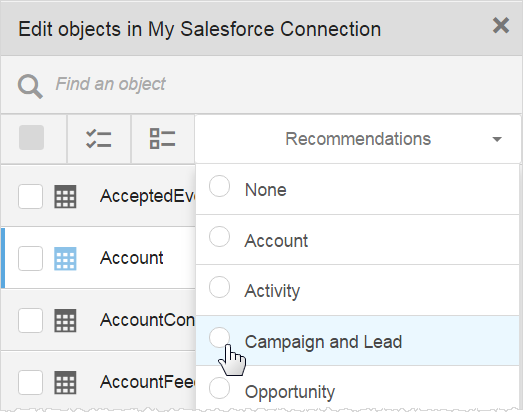
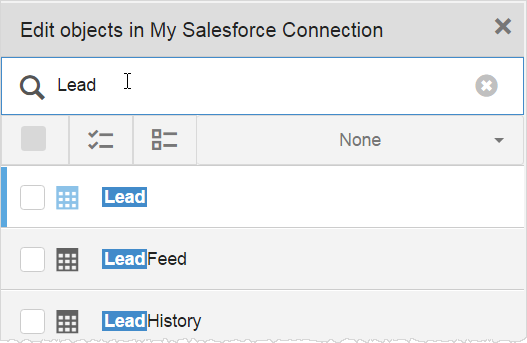
Alternatively, you can use the Find search feature to return a limited selection of tables based on your search criteria.
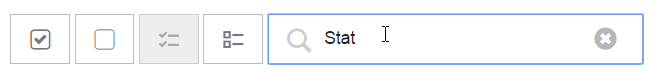
When you select a table, a preview of its contents displays in the main panel and by default, all of its columns are selected. Frequently, you will not need every column, so you can select only the ones that you want by using the Deselect All and Search box at the top right to find and select the desired columns.
Modeler highlights selected columns.
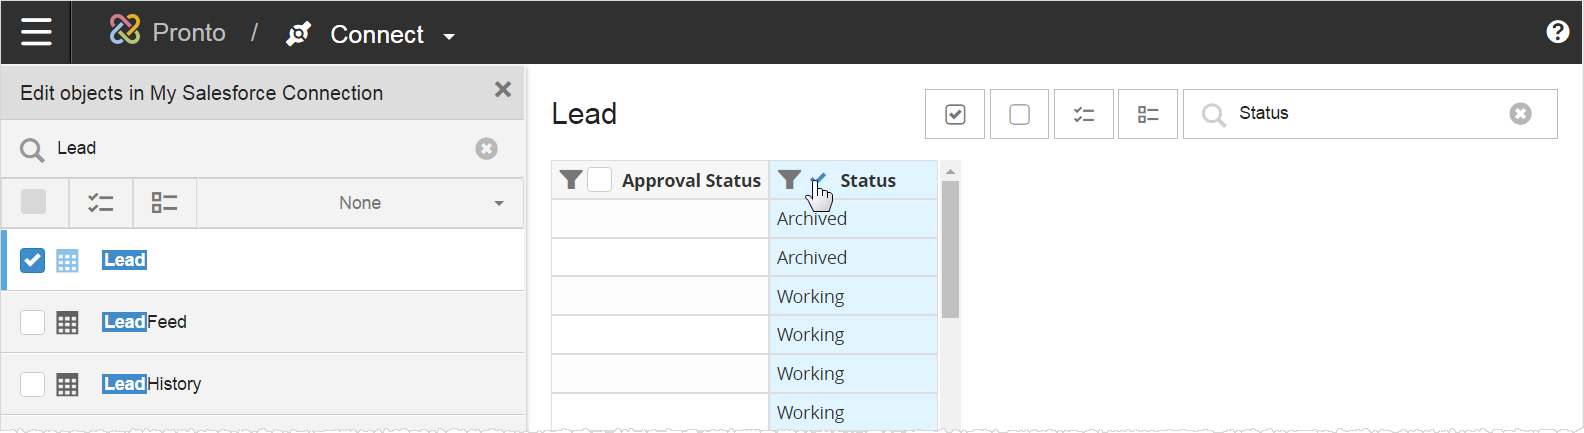
Filter Columns
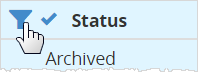
For each column you select, you can filter its columns, by clicking the filter icon at the top of a column. The filter you apply limits the number of rows extracted based on the filter criteria.
The filter panel lets you select a valid operator based on the data type such as equal to, greater than, less than, not equal to, etc... You need to provide a valid value for the selected column.
Note: The filter operators will vary based on whether the column selected is a measure or an attribute.
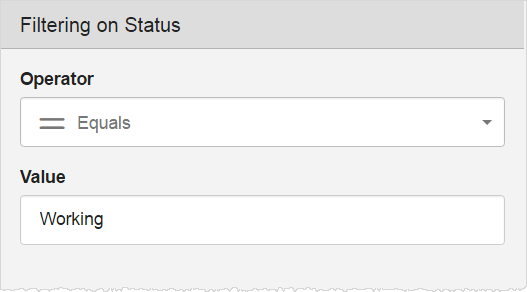
When you enter a filter and click Apply, the preview panel updates displaying only the rows that match the filter criteria. Selected filter tag(s) display at the top of the table.
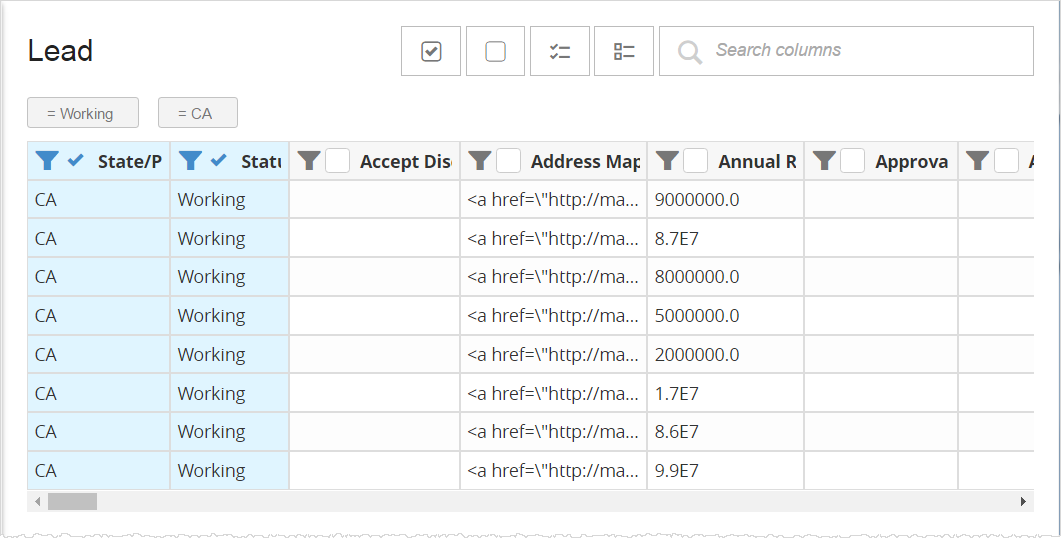
Select more columns and add filters for additional tables as needed.
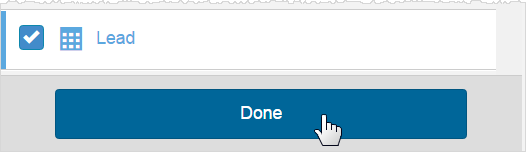
Click Done.
Don't worry if you don't get everything the first time you can go back and update the connection's tables and rows later.
If you used a recommendation, make sure to scroll through the columns to see what was selected by default.
Tip: If there are a large number of rows, Modeler will let you know. This is to keep you from downloading a large amount of data. If you see a warning, double-check your selections or add filters before proceeding.
The Connect page refreshes, displaying only the tables you selected, and a preview of all the rows. You can click Edit, to continue refining the columns you want to select for each table.
Note: The Database Connector removes certain types of columns from preview data response. Some data types provide unusable data (Binary data), so those columns are removed from preview data response. List of data types for which we ignore columns:
- BINARY
- VARBINARY
- LONGVARBINARY
- BLOB
- CLOB
- NCLOB
Import Data
When you have everything you want, click Import at the bottom of the tables list. This time, Birst extracts all the data that matches the criteria you set up.

The progress bar displays at the bottom left, and a success message appears in the upper right when it is done.
Your data is now in Birst and ready to prepare for reporting. You can create multiple prepared sources from the “raw” or extracted sources that you just created with the Connect page. This is an efficient way to manage your reports, especially when you have different uses for the same tables.
The next step is to prepare the data using the Prepare page. Keep in mind, you can also join tables using the Prepare page where many users may find the User Interface easier to create those query objects using prepared sources.
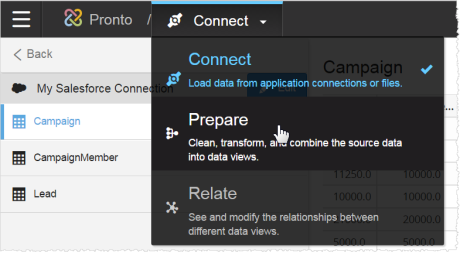
The Prepare page lists all your tables and has a work area for preparing sources.
Next Steps: Prepare Data