Filter a report in Classic Designer by clicking on the blue underlined text in a table or by clicking on a chart segment.
Another way to filter is by dragging a capture rectangle around the attribute values in a table or chart. This is called visual filtering.
Important: Visual filtering is not supported for tree maps, pyramids, funnels, geo maps, gauges and radar charts.
To filter data in a report in Designer
| 1. | Open the report you want to work with in Designer. |
| 2. | Do one of the following: |
Click on a hyperlink in the table or on a segment in the chart.
If drill
maps have been set up by your Space Administrator, you can right-click on
a hyperlink in the table to select the column to drill to as in the example
below.
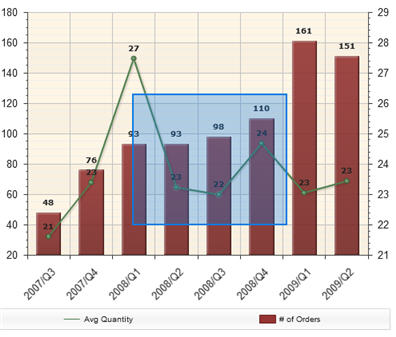
Drag a capture rectangle
around the attribute values in a table or chart by clicking and holding
down the mouse button and dragging across the desired region as in the
examples below.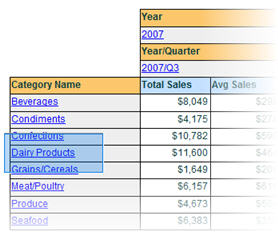
| 3. | The table or chart is filtered based on your selection; only the values you selected will be displayed. The prompt summary at the top will tell you what filters have been applied. For example: CategoryName = Dairy Products. |
| 4. | To remove a filter, click on the prompt summary. Select the desired filter in the dialog box, then click Delete. Click Save when you are finished. |
Tip: If hashmarks appear when you click on a chart segment, they indicate that you cannot drill any further.
Defining Filters
Filtering the Reports
on a Dashboard Page