and JavaScript in Dashboards 2.0
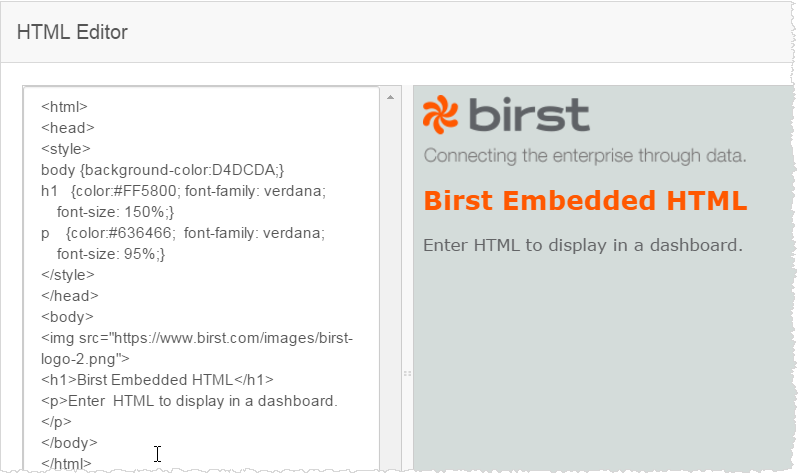
You can create a dashlet that contains your custom HTML. The HTML can reference an external CSS file or use internal styling. Important: HTML dashlets are not approved for use with Infor Government Solutions (IGS).
The custom HTML can include JavaScript. You can use 3rd party visualization libraries such as the Google Visualization API or D3.js.
Tips:
- The URL of the 3rd party code must be publicly accessible. If you do not see the website in the preview, the site may be configured to not allow embedding on other websites.
- Any URLs in the code must use HTTPS because Birst is hosted over HTTPS.
- Because the HTML is already inside Birst, a login token is not required in the code.
- Although you can define CSS directly inside the HTML Editor, the custom style must only affect the external visualization and not conflict with the overarching Dashboards 2.0 theme.
- If the JavaScript is lengthy, consider providing some of it in a JavaScript library and then include a JavaScript src source reference to it in the HTML Editor.
To embed HTML in a dashlet
- Go to Edit mode of a dashboard.
- From the Add menu (+) click HTML.

- In the HTML Editor type or paste the HTML code. A preview of it displays in the right side panel.
Examples of Embedded HTML and JavaScript Visualizations
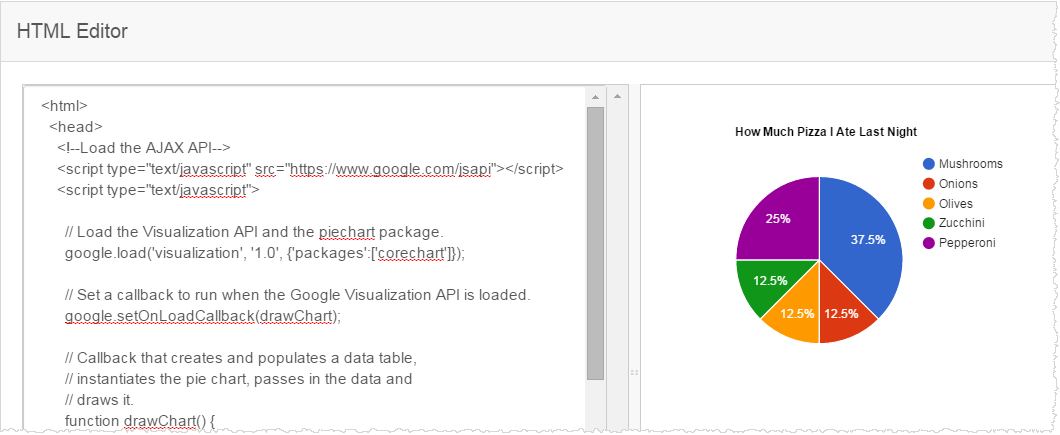
Embedding a Google Visualization
The example makes a pie chart using the Google charting library. Copy/paste the code into the HTML window and Birst displays a preview of the chart.
See the example code: Embedded Charting JavaScript Example.
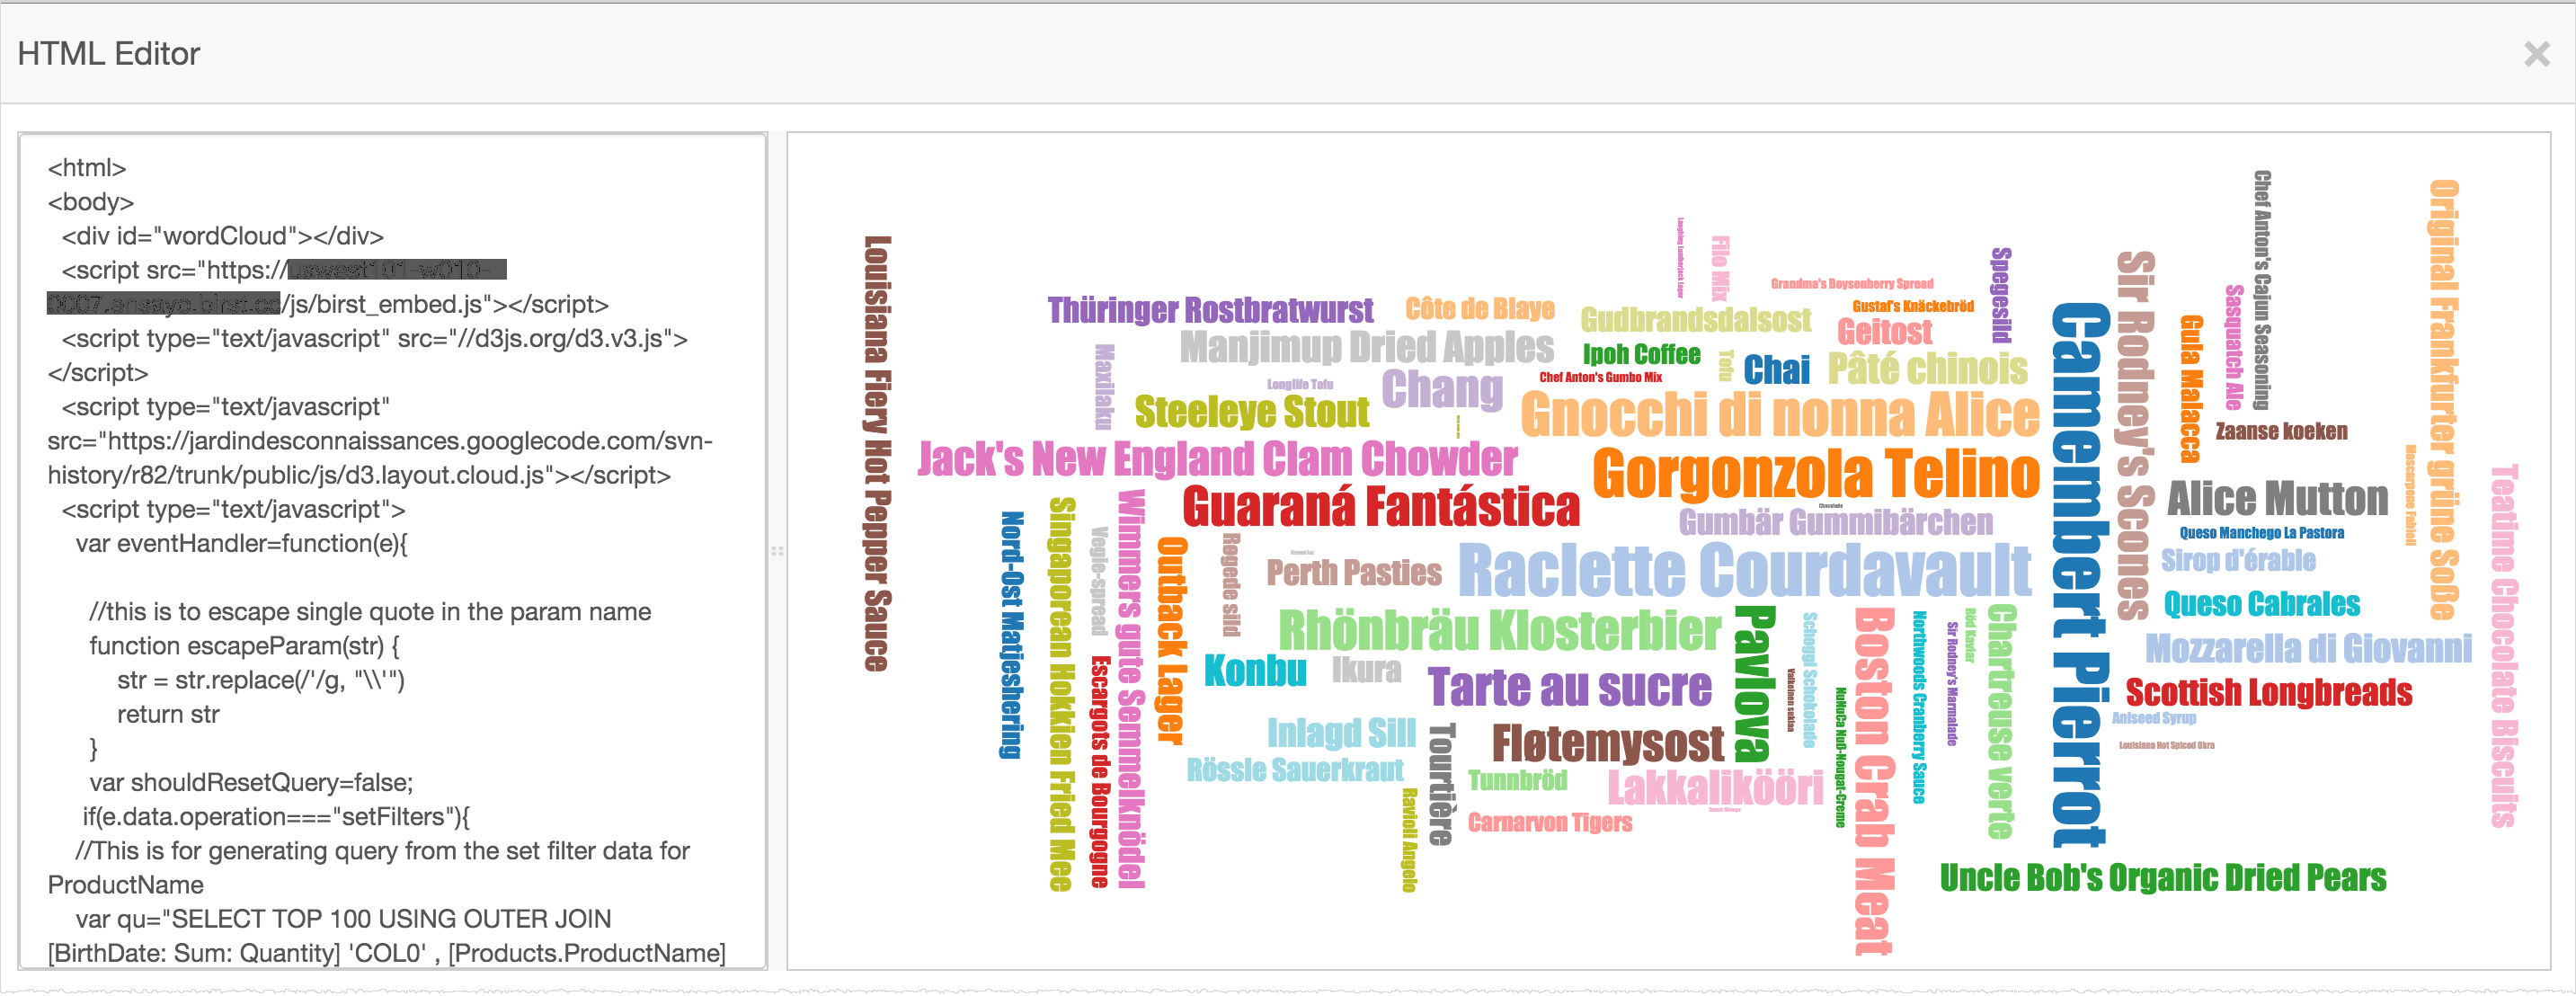
Embedding a D3 Visualization
The example uses the Dashboards 2.0 JavaScript API functionality to display a tag cloud from a Birst query.
See the example code: Update D3 Using BQL Example.
See also Embedding API for JavaScript.