Usage Tracking Reference
This topic describes the data model and reports provided in a usage tracking space. For an overview and instructions see Setting Up Usage Tracking.
- Implementation Notes
- Usage Tracking Data Model
- Usage Tracking Subject Area
- Reports on the Summary Dashboard
Implementation Notes
- Opening a dashboard triggers a record insertion in the Usage table, of one or several rows of usage tracking per user, and one row per report dashlet:
- Session ID
- Sequence ID
- UserName
- Dashboard ID and Name
- Dashlet Name
- Dashlet duration (elapsed time)
- Action = ‘Dashboard’
- Timestamp (date hour of starting the action)
- Space ID and Name
-
When a user refreshes, closes and re-opens, or drills to another dashboard that has a report, Birst creates new usage records.
- When a user opens a dashboard that does not contain a Visualizer or Designer report, Birst does not generate any usage tracking activity. If a page only contains KPIs, buttons, etc. and no report, no session or activity is recorded.
- Only the exports from Designer in .csv and .xls format are tracked, other formats are not tracked. Export activity from Visualizer and dashboards is not tracked. Activity on Designer and Visualizer is recorded only for saved reports. If you create a report without saving it, no activity is recorded.
- Modifying the filters of a dashboard (changing / removing values) does not generate new usage traces.
Usage Tracking Data Model
The Usage Tracking data model contains dimensions (attributes) and measures for dashboard, report, and user login activity.
The usage source is the primary source and all other sources are scripted source based on it.
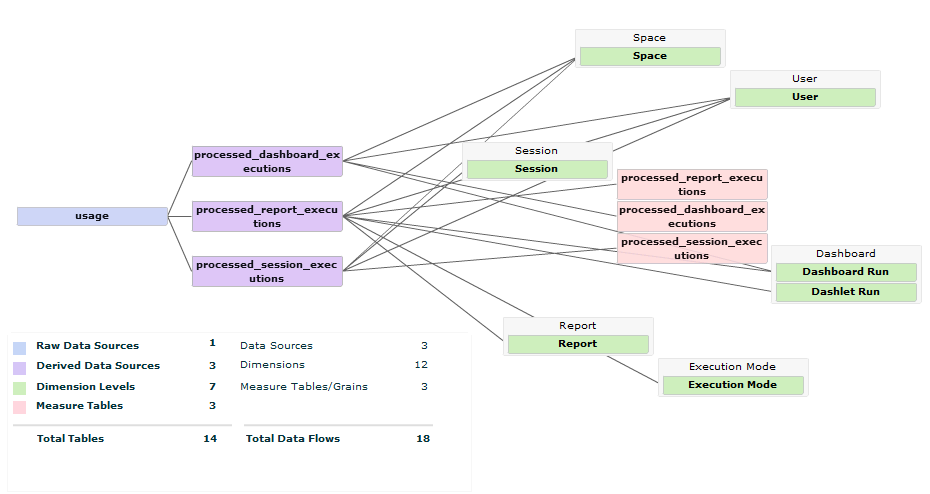
Usage contains the information described as follows.
Usage Dimension (Attributes) Tables
| Table | Column | Description |
|---|---|---|
| User | User ID | Internal ID for the logged-in user. |
| User Name | User name of the logged-in user. | |
| Space | Space ID | Internal ID of the space. |
| Space Name | Name of the space. | |
|
Session
|
SessionElapsedTime | Duration of the user session. The session begins when the user accesses Visualizer or Designer reports or dashboards. |
| Session ID | Internal ID of the session. | |
| Session Run Time | Time stamp of the session. | |
| SessionStartHour | Custom attribute for the hour of the session. | |
| SessionTimeOfDay | Custom attribute for the time window of the session (12am-6am, 6am-9am, 9am-Noon, Noon-3pm, 3pm-6pm, 6pm-9pm, 9pm, 12). | |
| SessionTimeOfDaySorted | Custom attribute for a sorted integer of the time window, starting at 1 for 6am-9am. | |
| Dashboard Run and Dashlet Run | # Dashlet Executed | Number of report-containing dashlets executed. This is more useful as a measure than as an attribute. |
| Dashboard Run Time | Timestamp of when a dashboard was executed. | |
| Dashboard Run Epoch Time | Timestamp of when a dashboard was executed in Epoch milliseconds. | |
| Dashboard Elapsed Time |
For Dashboards 2.0: The time taken to fetch all the dashlet reports definition. It does not include the query execution time. For Original Dashboards: The same, but it does include the query execution time. |
|
| Dashboard Name | Name of the dashboard. Includes the path for Original Dashboards. | |
| Dashboard Run ID | Internal ID that groups report-containing dashlets on a dashboard. For example, if there are two report dashlets on a dashboard, both of them will share the same Dashboard Run ID. | |
| Dashlet Report Path | The name of the dashlet report. | |
|
API and API Report For the report-related APIs, getReportData and saveQueryReport. |
API Run Time | Timestamp of when the API was called. |
| API Run Epoch Time | Timestamp of when the API was called in Epoch milliseconds. | |
| API Elapsed Time | Execution time for the API. | |
| API Signature | Name of the report API, either executeQueryInSpace, getReportData, or saveQueryReport. | |
| API Report Path | Name of the report used in either getReportData or saveQueryReport. | |
| Execution Mode | Execution Mode |
Signals the trigger or the origin of the transaction:
|
Usage Measure Table
Measures are helpful for getting a count of a metric. For example, the Count of Dashboard Run ID indicates the total number of dashboards that were executed.
| Name | Description |
|---|---|
| #Dashlets Executed | Number of report-containing dashlets that were executed. |
| DaysSinceLastSession | A custom measure that calculate the days since the last session. |
| SessionID | Internal ID of the user session. |
| Session Events | The total number of recorded session events. For example, if a user accessed two dashboards, each containing two report dashlets, then the total number of session events is 4. |
| Report Run Time |
Timestamp of when a report dashlet was executed. |
| Report Epoch Run Time | Timestamp of when a report dashlet was executed in Epoch milliseconds. |
| Report Elapsed Time |
For Dashboards 2.0 - The time taken to fetch the dashlet reports definition. It does not include the query execution time. For Original Dashboards - The same, but it does include the query execution time. |
| Dashboard Run Time | Timestamp of when a dashboard was executed. |
| Dashboard Run Epoch Time | Timestamp of when a dashboard was executed in Epoch milliseconds. |
| Dashboard Elapsed Time |
For Dashboards 2.0 - The time taken to fetch all the dashlet reports definition. It does not include the query execution time. For Original Dashboards - The same, but it does include the query execution time. |
| API Run Time | Timestamp of when the API was called. |
| API Run Epoch Time | Timestamp of when the API was called in Epoch milliseconds. |
| API Signature | |
| Dashboard Run ID | Internal ID to group report-containing dashlets on a dashboard. For example, if there are two dashlets/reports on a dashboard, both of them will share the same Dashboard Run ID. |
| Session Run Time | Time stamp of the session |
| Session Elapsed Time | Duration of the user session. The session begins when the user accesses Visualizer or Designer reports or dashboards. |
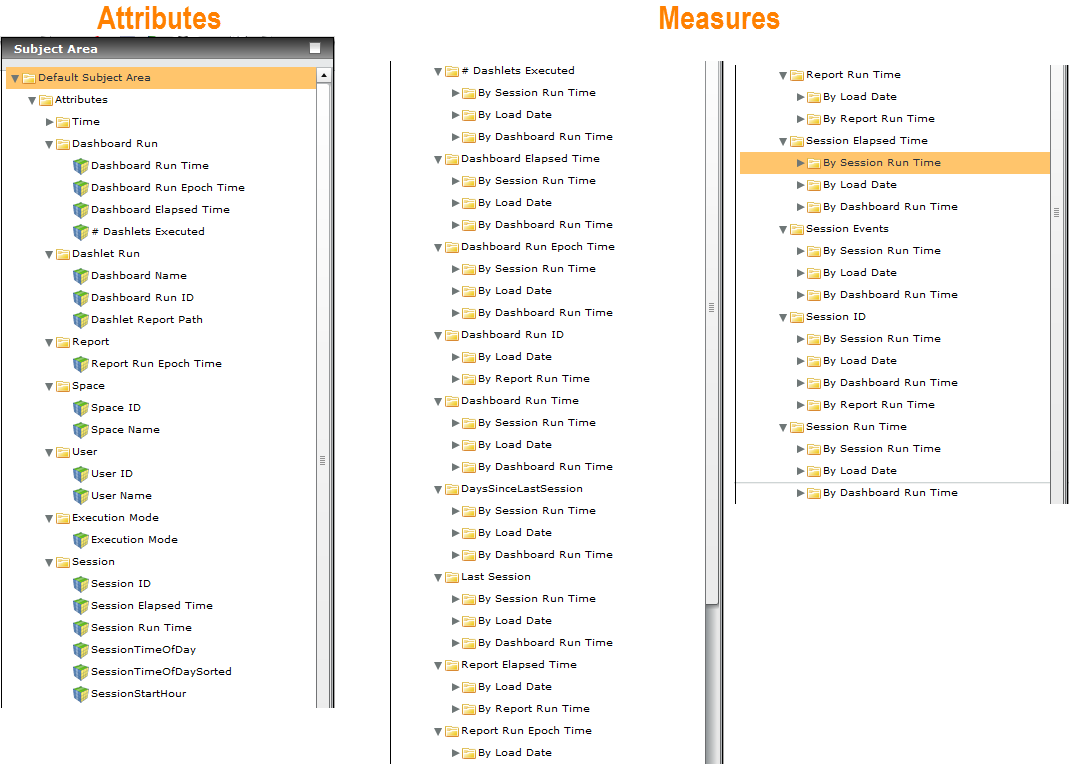
Usage Tracking Subject Area
In a Usage Tracking space, Visualizer and Designer list the attributes and measures.
Reports on the Summary Dashboard
The pre-built reports on the Summary dashboard include the following attributes and measures.
| Report Name | Attributes | Measures |
|---|---|---|
| Sessions per Date |
• Date = [Time.Date] • Space Name = [Space.Space Name] |
• Avg Duration (mins) = [Session Run Time: Avg: Session Elapsed Time]/60000 • Sessions = [Session Run Time: # Distinct Session ID] |
| Sessions per Weekday |
• Day of Week = [Time.Day of Week] • Space Name = [Space.Space Name] |
• Sessions = [Session Run Time: # Distinct Session ID] • Avg Elapsed Time = [Session Run Time: Avg: Session Elapsed Time] |
| Sessions per Time of Day |
• Time of Day = [Session.SessionTimeOfDay] • SessionTimeOfDaySorted = [Session.SessionTimeOfDaySorted] • Space Name = [Space.Space Name] |
• Avg Duration (mins) = [Session Run Time: Avg: Session Elapsed Time]/60000 • Sessions = [Session Run Time: # Distinct Session ID] |
| Access by Dashboard and Month |
• Space = [Space.Space Name] • Dashboard = [Dashboard.Dashboard Name] • Week Start Date = [Time.Week Start Date] |
• Accesses = [Report Run Time: # Dashboard Run ID] |
| Top Users |
• User = [User.User Name] • Space Name = [Space.Space Name] |
• Sessions = [Session Run Time: # Distinct Session ID] • Avg Session Duration (mins) = [Session Run Time: Avg: Session Elapsed Time]/60000 |
| Last Session by User |
• User = [User.User Name] • Space Name = [Space.Space Name] |
• Last Session = [Session Run Time: Last Session] • Days Since Last Session = [Session Run Time: DaysSinceLastSession] |
| Top Users | • User = [User.User Name] | • # API Calls = [API Run Time: # API Signature] |